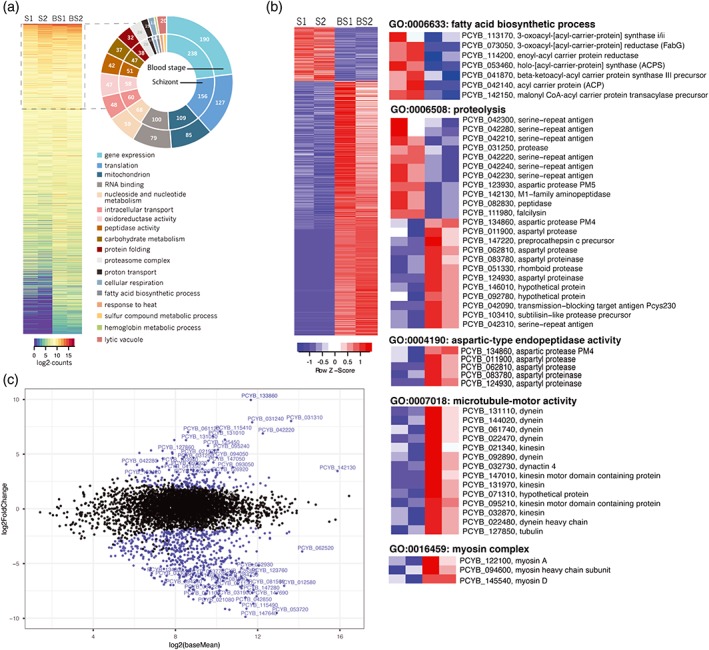
Figure 2.

The P. cynomolgi liver schizont transcriptome is enriched with mRNAs encoding components of the fatty acid biosynthesis pathway. (a) Heat map showing the gene expression (log2normalized‐read‐counts) of 4,801 genes with at least 1 CPM in at least two of the four schizont (S) and blood stage (BS) samples. Gene ontology (GO) terms enriched in genes with high expression (in the top 25% of expression levels) are represented in a doughnut graph to the right of the heat map. (b) Heat map showing the gene expression (log2normalized‐read‐counts centered and scaled for each row) of the 807 genes detected as differentially expressed between the schizont (S) and blood stage (BS) samples. Zooming in, specific GO terms of interest enriched within the list of differentially expressed genes are shown to the right of the heat map. (c) The mean expression of genes in the schizont and blood stage datasets (x‐axis) was compared to the log2(fold change) of gene expression in schizonts relative to the blood stages (y‐axis) and represented as an MA‐plot using the DESeq2 package. Genes with an FDR < 5% are represented with a blue dot and the names of those with a log2(fold change) >2 are shown
