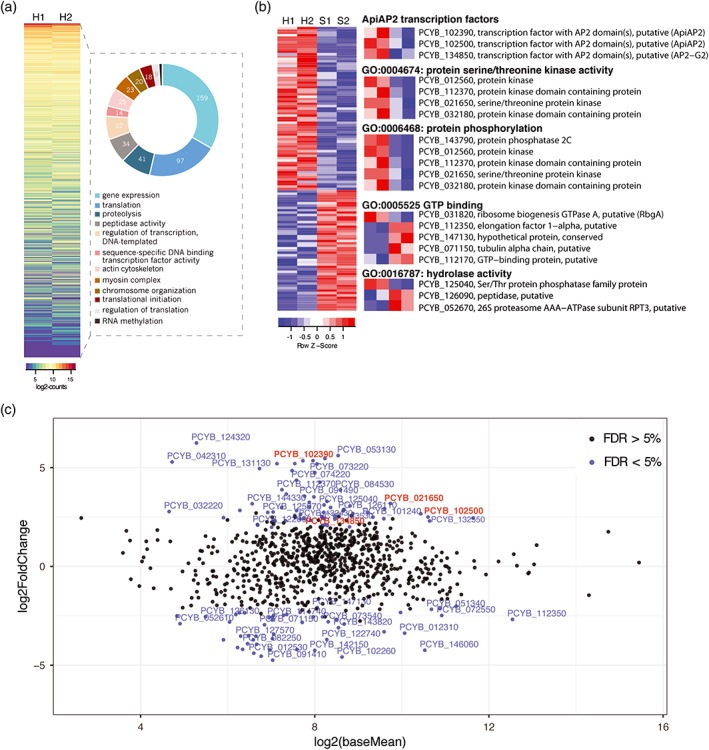
Figure 3.

The quiescent state of the P. cynomolgi hypnozoite may be regulated by transcription factors of the ApiAP2 family and translational repression by the eIF2a kinase eIK2. (a) Heat map showing the gene expression (log2normalized‐read‐counts) of 880 genes with at least one read count in both hypnozoite (H) replicates. Gene ontology (GO) terms enriched in all 880 genes are represented in a doughnut graph to the right of the heat map. (b) Heat map showing the gene expression (log2normalized‐read‐counts centered and scaled for each row) of the 120 genes detected as differentially expressed between the hypnozoite (H) and schizont (S) samples. Zooming in, specific GO terms of interest enriched within the list of differentially expressed genes are shown to the right of the heat map. (c) The mean expression of genes in the hypnozoite and schizont stage datasets (x‐axis) was compared to the log2(fold change) of gene expression in hypnozoites relative to schizonts (y‐axis) and represented as an MA‐plot using DESeq2. Genes with an FDR < 5% are represented with a blue dot and the names of those with a log2(fold change) >2 are shown. Genes of interest are highlighted in red
