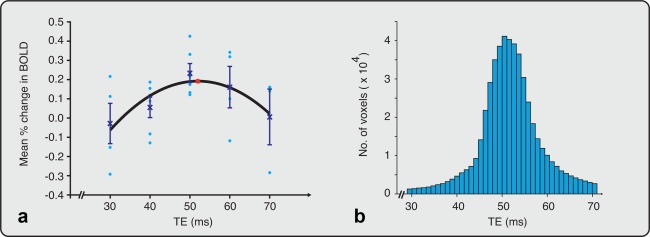
Figure 1.

Calculation of the optimal TE across the whole brain. (a) Mean percentage change in BOLD was calculated from EPI data collected at five different echo times (n = 23, TE range: 30–70 ms). The mean (crosses) and standard error of the mean are indicated at each TE. A second‐order polynomial was fitted to the data (black line). An asterisk (red) identifies the TE at which the fitted curve is maximal (TE = 52 ms). The circles (light blue) represent the mean percentage change in BOLD in individual infants. (b) Histogram of the optimal TE calculated for each voxel (range: 30–70 ms). The average optimal TE = 52 ms. BOLD, blood oxygen level dependent; EPI, echo planar imaging; TE, echo time.
