
Figure 1.
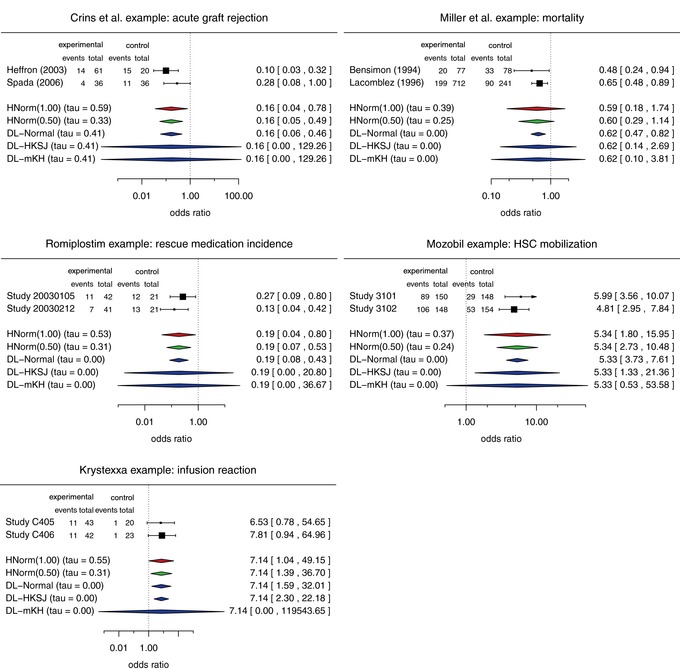
Forest plots for the five examples from rare diseases with various estimates of the treatment effect. In each panel, the top two rows show the data (numbers of cases and events in experimental and control groups) and the odds ratios with their 95% confidence intervals. The following rows show the different combined odds ratios and the estimated heterogeneity (posterior medians for the Bayesian approach).