
Figure 2.
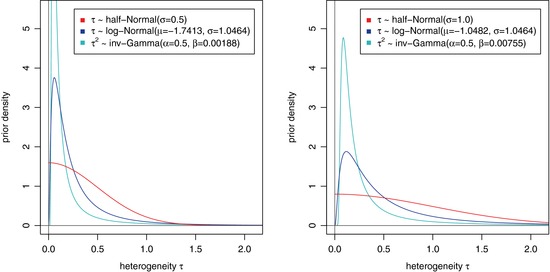
Densities of priors for the between‐trial heterogeneity used in the sensitivity analyses. The parameters for the log‐normal and inverse‐Gamma distributions were chosen so that the 5% and 95% quantiles match with those of the corresponding half‐normal distributions, that is HN(0.5) and HN(1.0) in the left and right panel, respectively.