
Figure 1.
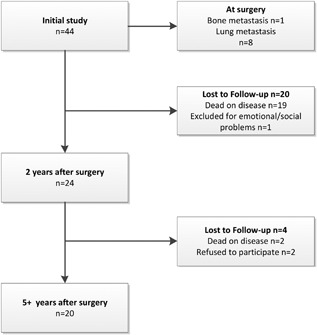
Flow chart showing the number of patients in the original study and the follow‐up study
Official websites use .gov
A
.gov website belongs to an official
government organization in the United States.
Secure .gov websites use HTTPS
A lock (
) or https:// means you've safely
connected to the .gov website. Share sensitive
information only on official, secure websites.
Flow chart showing the number of patients in the original study and the follow‐up study