Figure 1.

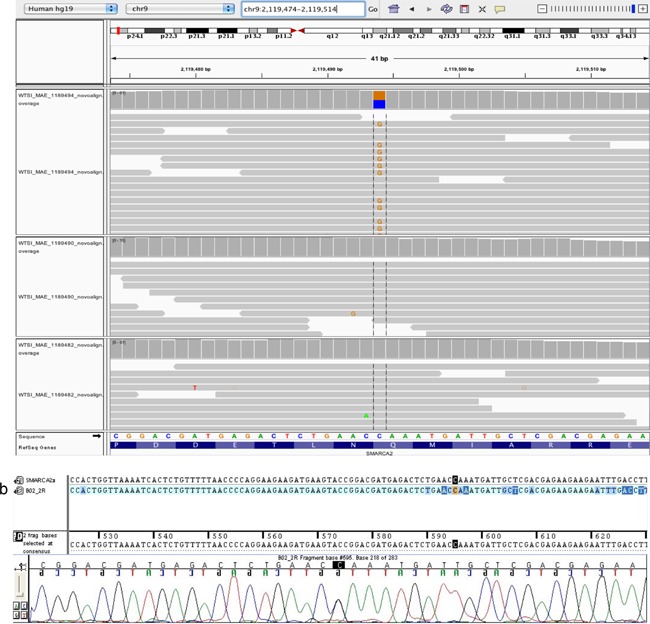
a: IGV plot demonstrating the de novo SMARCA2 mutation; patient (top), mother (middle), and father (bottom). b: Sanger sequencing chromatogram of the patient's SMARCA2 mutation. [Color figure can be viewed at wileyonlinelibrary.com].

a: IGV plot demonstrating the de novo SMARCA2 mutation; patient (top), mother (middle), and father (bottom). b: Sanger sequencing chromatogram of the patient's SMARCA2 mutation. [Color figure can be viewed at wileyonlinelibrary.com].