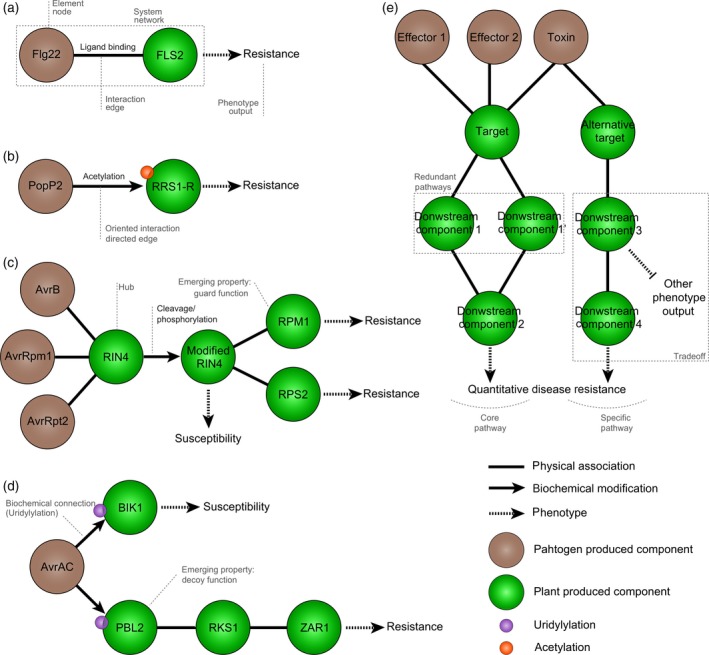
Figure 1.

Progression of network‐like representations of molecular plant–pathogen interactions.
(a) The direct perception of a pathogen PAMP (such as flg22) by a plant receptor (FLS2) can be seen as the simplest form of network with two connected nodes.
(b) Similarly, the direct interaction of a pathogen effector (such as Ralstonia solanacearum PopP2) with its plant target (such as the Arabidopsis thaliana R‐protein RRS1‐R) is a simple two‐node network. PopP2 modifies RRS1‐R by acetylation. This modification is not reciprocal, the interaction is oriented.
(c) In the guard model, modification by effectors (such as AvrB, AvrRpm1 and AvrRpt2) of a plant target (such as RIN4) is monitored by plant resistance proteins (RPM1 and RPS2), which are not directly interacting with effectors. In this example, RIN4 in connected to multiple nodes and can be designated as a hub.
(d) In the decoy model, a pathogen effector (such as AvrAC) interacts with an operative target (BIK1) to promote plant susceptibility, but can also interact with a decoy target (PBL2), guarded by a R‐protein complex (RKS1 and ZAR1) leading to plant resistance.
(e) Quantitative disease resistance likely involves a complex network integrating several input signals (Effector 1, Effector 2, toxin,…) perceived simultaneously and signaling through common (‘core’) or specific pathways to initiate plant defense responses. Pathogen molecules are shown as brown circles and plant molecules as green circles.
