Figure 6.

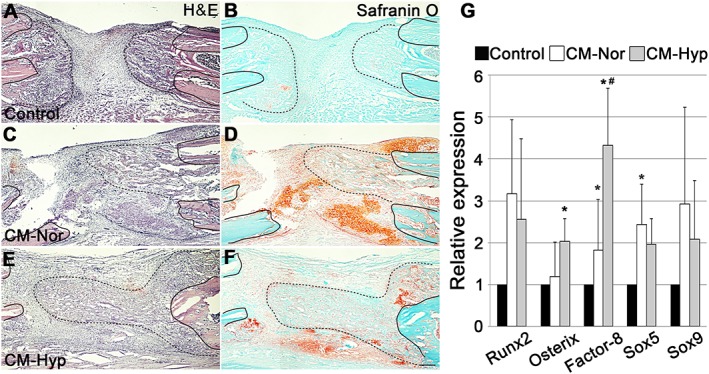
Local administration of CM–Hyp promotes new callus formation in the DO gap: representative micrographs of sections displaying the DO gap stained with H&E (A, C, E) and safranin O–fast green (B, D, F); n = 5. Black line on each figure indicates the end of the distal (left side) and proximal (right side) bone fragment; line of black dots on each figure shows newly formed callus: neocallus formation and much fibrous tissue were evident within the DO gap in the control group at day 13 (A, B); little cartilage was observed in the control group (B); the DO gap in the CM–Hyp group showed well generated newly formed callus and periosteum‐derived cartilage (E, F); the gap in the CM–Nor group showed massive cartilage and a little callus formation (C, D). To evaluate the effect of the CM on mRNA, DO gap tissue was taken from each group at day 13 (n = 5); qPCR results showed significant differences between exposure to CM–Nor and CM–Hyp in Factor 8 gene mRNA (G). Data represent mean ± SD; *p < 0.05 vs control, # p < 0.05 vs CM–Nor; bar = 250 µm. [Colour figure can be viewed at wileyonlinelibrary.com]
