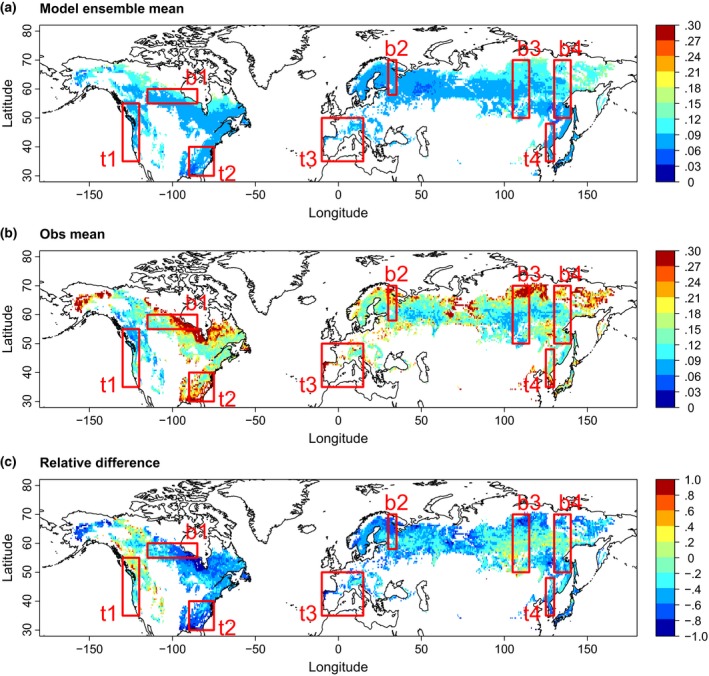
Figure 1.

Spatial patterns of forest k [yr−1] as the ratio of NPP to biomass (a) simulated by GVMs participating in ISI‐MIP (ensemble mean of HYBRID4, JeDi, JULES, LPJml, ORCHIDEE, SDGVM, and VISIT) and (b) based on satellite data (Obs mean; using an average of MODIS and BETHY/DLR NPP products and observation‐based biomass from Thurner et al. 2014). The relative difference of (a) with respect to (b) is shown in (c). Only areas with at least 40% forest cover are considered. Red boxes show selected transects (see Appendix S1): b1 Canada, b2 Karelia/Western Russia, b3 Central Siberia/Baikal, b4 Eastern Siberia, t1 Western North America, t2 South‐Eastern North America, t3 South‐Western Europe, t4 North‐Eastern China/Korea
