
Figure 5.
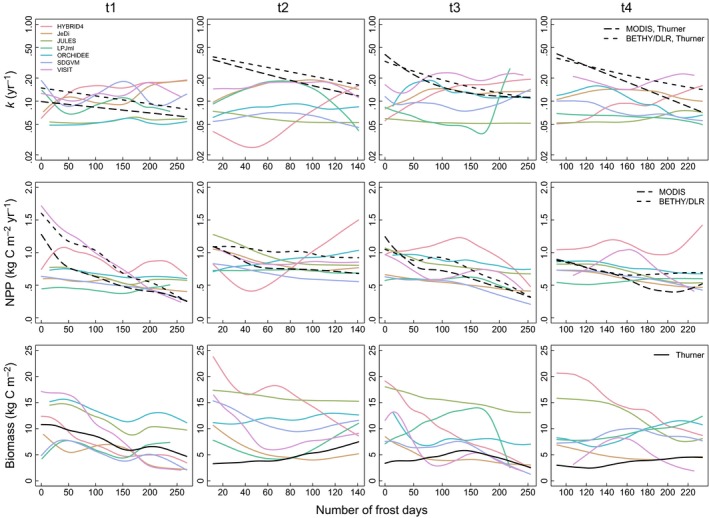
Simulated (coloured lines) and observation‐based (black lines) k, NPP, and biomass as a function of the number of frost days during a year in temperate forest transects (t1 Western North America, t2 South‐Eastern North America, t3 South‐Western Europe, t4 North‐Eastern China/Korea). For k and NPP, long‐dashed black lines correspond to the use of MODIS NPP and dashed black lines to the use of BETHY/DLR NPP. Observation‐based biomass has been estimated by Thurner et al. (2014). Exponential functions have been fitted to the observation‐based relationships between k and the climate variable (cf. Appendix S2). All other observation‐based and the simulated relationships between k, NPP, or biomass and the climate variable are represented by smoothing spline fits (Chambers & Hastie, 1992) to the scatter plots (see Appendices S7–S9 for original scatter plots)