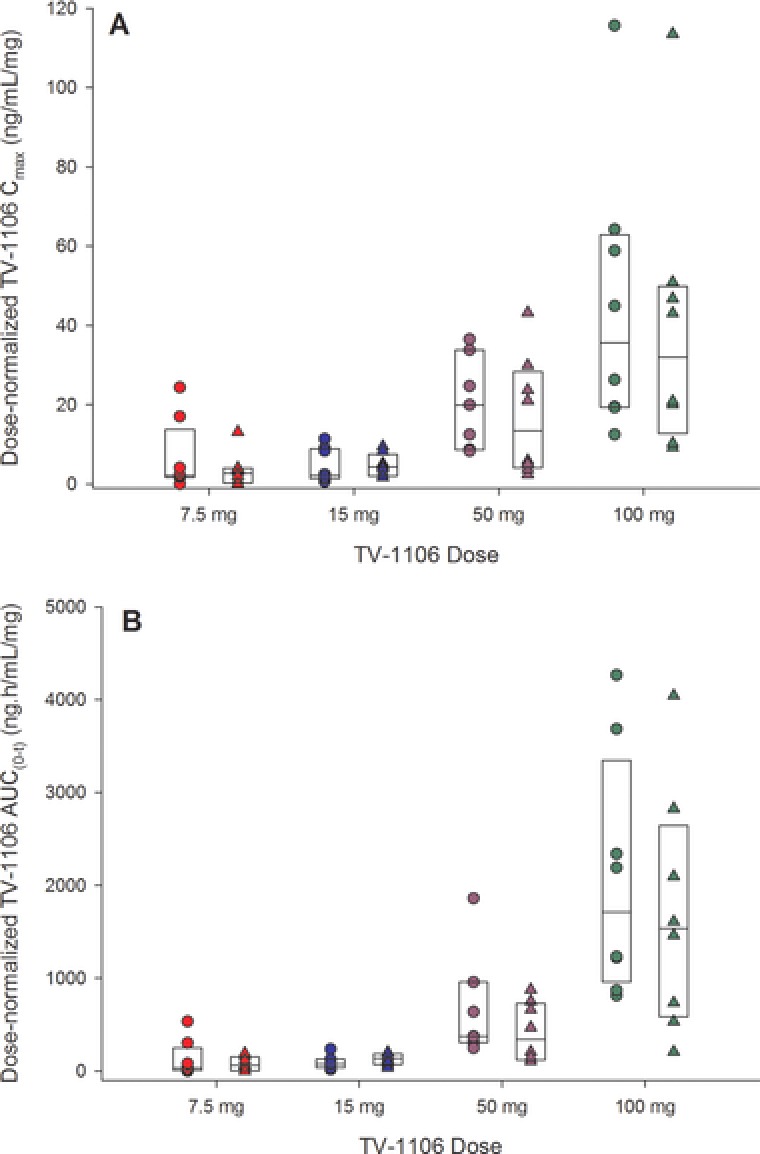
Figure 2.

Box plots of (A) dose‐normalized serum TV‐1106 maximum concentrations (Cmax) and (B) area under the serum concentration–time curve from zero to the time of the last quantifiable concentration (AUC0–t) versus dose split by population. The boxes represent the median, 25th, and 75th percentiles. The circles are the individual values for Japanese subjects, and the triangles are individual values for caucasian subjects.
