
Figure 3.
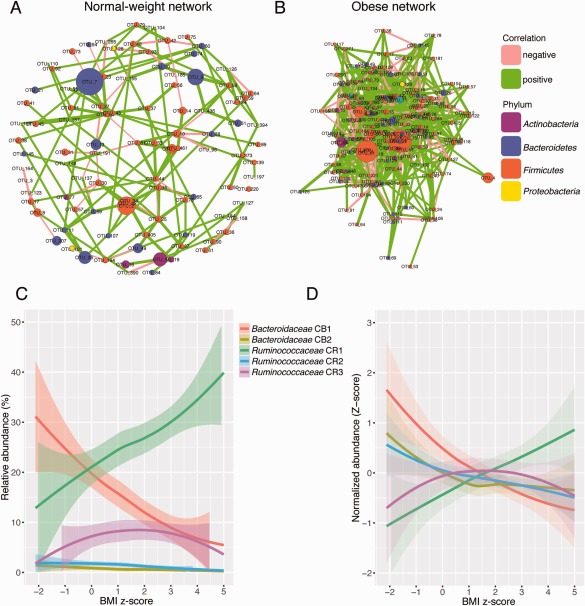
Correlation networks of samples from normal‐weight and obese children.
A, B. Networks show significant positive (green) and negative (pink) pairwise correlations between operational taxonomic units (OTUs). OTUs are coloured by phylum affiliation and sized by mean relative abundance.
C, D. Correlating communities of Bacteroidaceae (CB) and Ruminococcaceae (CR) and their abundances with respect to BMI z‐score. Relative abundances (C) and z‐score transformed abundances (D) are shown. Data points were processed using Lowess smoothing and 95% confidence intervals are shown.