
Figure 1.
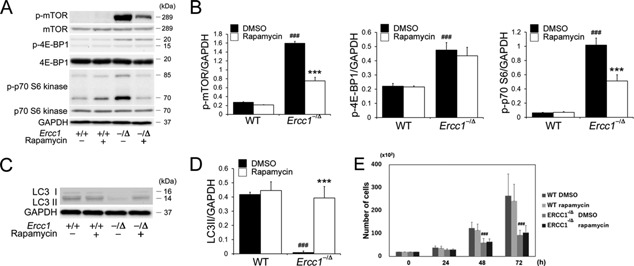
Measuring mTOR activity and autophagy in MDSPCs isolated from progeroid Ercc1 −/Δ mice. (A) Shown is a representative image of immunoblotting to measure mTOR, p‐mTOR, p‐4E‐BP1, and p‐p70 S6 expression in MDSPCs isolated from Ercc1 −/Δ and WT mice cultured with and without rapamycin. (B) Quantification of p‐mTOR, p‐4E‐BP1, and p‐p70 S6 expression relative to GAPDH. Error bars indicate the standard deviation. Statistical significance was determined using one‐way ANOVA or the Kruskal–Wallis test with Tukey–Kramer or Scheffe's post hoc test (n = 4). ### p < 0.001 versus WT‐DMSO, ***p < 0.001 versus ERCC1 −/Δ‐DMSO. (C) Representative image of immunoblotting to measure autophagy markers LC3 I and II expression in MDSPCs isolated from Ercc1 −/Δ and WT mice cultured with and without rapamycin. (D) Quantification of LC3II expression relative to GAPDH expression. Error bars indicate the standard deviation. Statistical significance was determined using the Kruskal–Wallis test with Scheffe's post hoc test (n = 4). ### p < 0.001 versus WT‐DMSO, ***p < 0.001 versus Ercc1 −/Δ‐DMSO. (E) Proliferation of MDSPCs measured using live‐cell imaging. Error bars indicate the standard deviation. Statistical significance was determined using one‐way ANOVA with Tukey–Kramer post hoc test (n = 4). ### p < 0.001 versus WT‐DMSO.