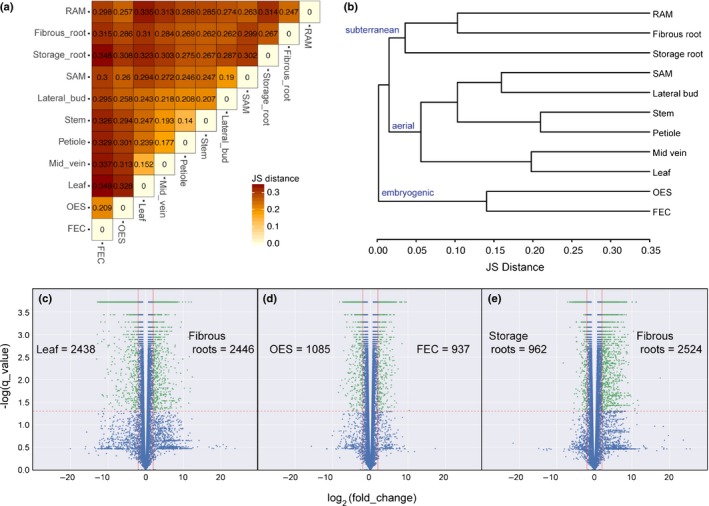
Figure 2.

Comparison of global gene expression patterns across 11 cassava (Manihot esculenta) tissue/organ types. (a) Heatmap showing every pairwise comparison for the 11 tissue/organ types sampled, as produced by CummeRbund's csDistHeat() method. Lighter colors correspond to more closely related sample types. The numbers in each cell represent the Jensen–Shannon (JS) distance between those two samples using the mean expression values of the biological replicates. (b) Output of CummeRbund's csDendro() method. This dendrogram is created using the JS distances calculated between the consensus expression values of genes for each sample type. A low squared coefficient of variation for biological replicates was observed indicating the high quality of this dataset (Supporting Information Fig. S1A). (c–e) Volcano plots showing the differential expression of genes from leaf to fibrous roots (c), OES to FEC (d) and storage root to fibrous root (e) using FDR corrected P‐value as the y axis. Number of genes significantly up‐regulated in each sample type, for each comparison, are listed. Red vertical lines: ± log2(fold_change) = 2, red horizontal line: log score = 1.3. The green points indicate significantly differentially expressed genes based on these cutoffs. Shoot apical meristem (SAM), root apical meristem (RAM), organized embryogenic structure (OES) to friable embryogenic callus (FEC).
