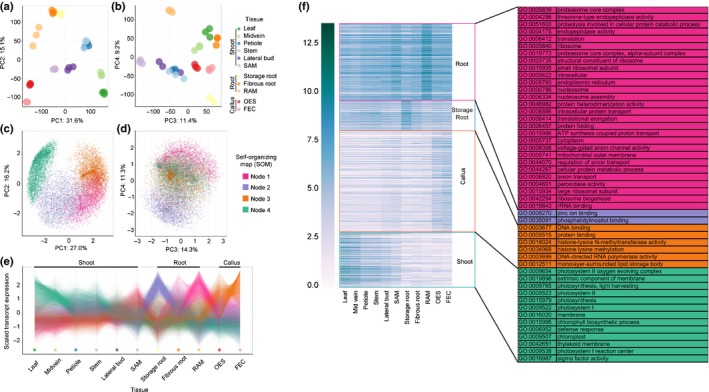
Figure 3.

Transcript expression profiles across cassava (Manihot esculenta) samples. (a, b) Principal component analysis (PCA) performed on replicates of samples, using transcript expression levels. (c, d) PCA performed on transcript profiles, across samples. Colors correspond to self‐organizing map (SOM) nodes used to find transcripts with similar expression profiles, which cluster together in the PCA space. (e) Scaled transcript expression profiles of SOM nodes across tissue/organ types. (f) Heatmap of genes showing gene expression pattern corresponding to the nodes in (c, d). Gene ontology (GO) terms associated with these genes are listed on the right. Shoot apical meristem (SAM), root apical meristem (RAM), organized embryogenic structure (OES) to friable embryogenic callus (FEC).
