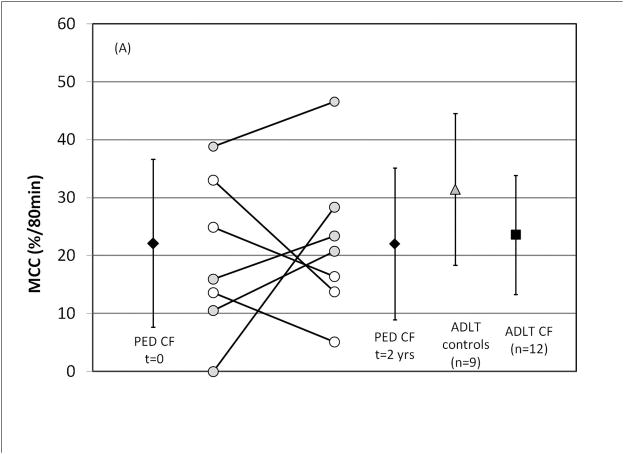
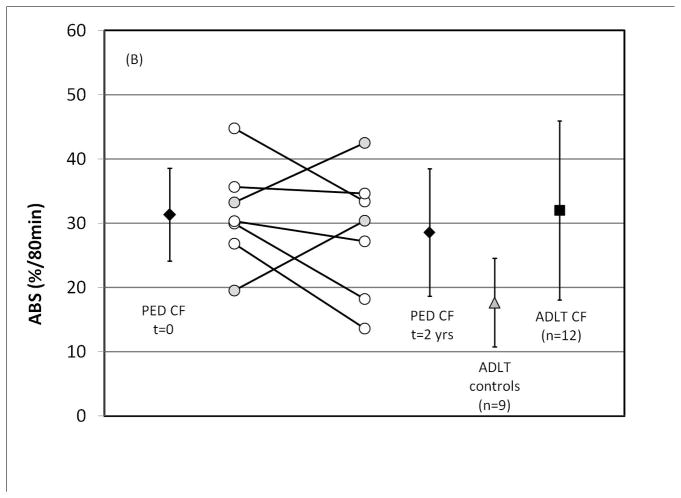
FIGURE 6.
Longitudinal measures of (A) MCC and (B) ABS in pediatric CF patients over a two-year period. Previous data from adult CF and adult control subjects is included for comparison (Ref. 12) All ± SD. For paired symbols gray fill represents an increase and white fill a decrease.


