
FIG 3 .
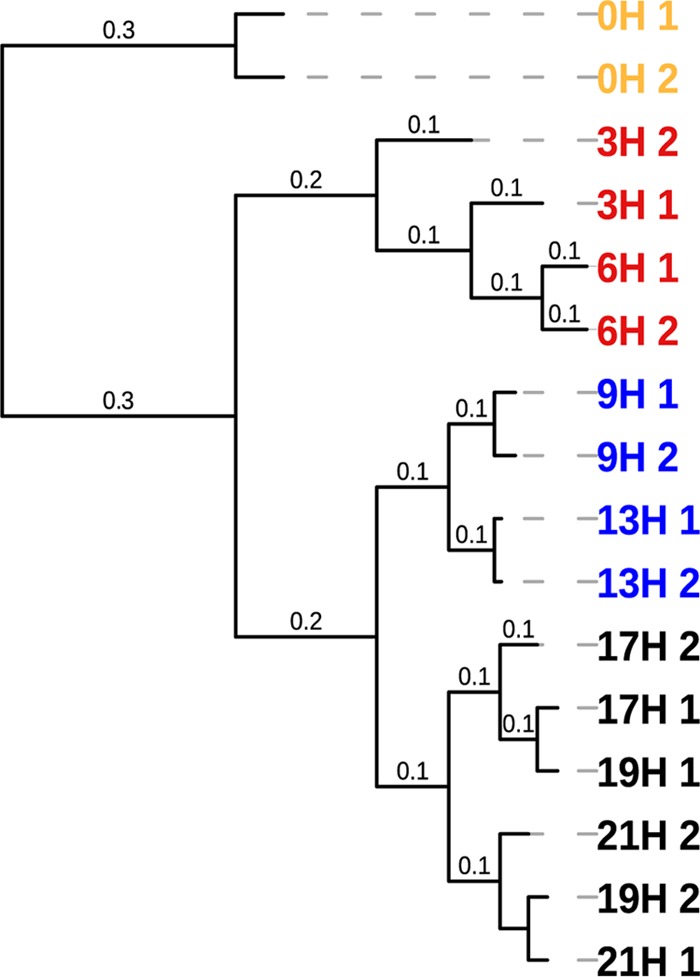
Hierarchical cluster analysis of reproducible parent masses (MS) representative of produced SMs from oral in vitro-grown biofilm representing >100 bacterial species. MS profiles from replicate growth medium extracts were obtained from several growth stages: from 0 h (the time point when saliva was inoculated into SHI medium) to 21 h of incubation in SHI medium and sucrose. Pearson correlation distances are shown at tree branches. Distinct clusters of MS profiles are shown as colored leaves on the tree. Yellow leaves, 0 h of growth (0H) with saliva inoculated in SHI medium and sucrose; red leaves, 3 and 6 h of growth (3H and 6H, respectively); blue leaves, 9 and 13 h of growth (9H and 13H, respectively); black leaves, 17, 19, and 21 h of growth (17H, 19H, and 21H, respectively).