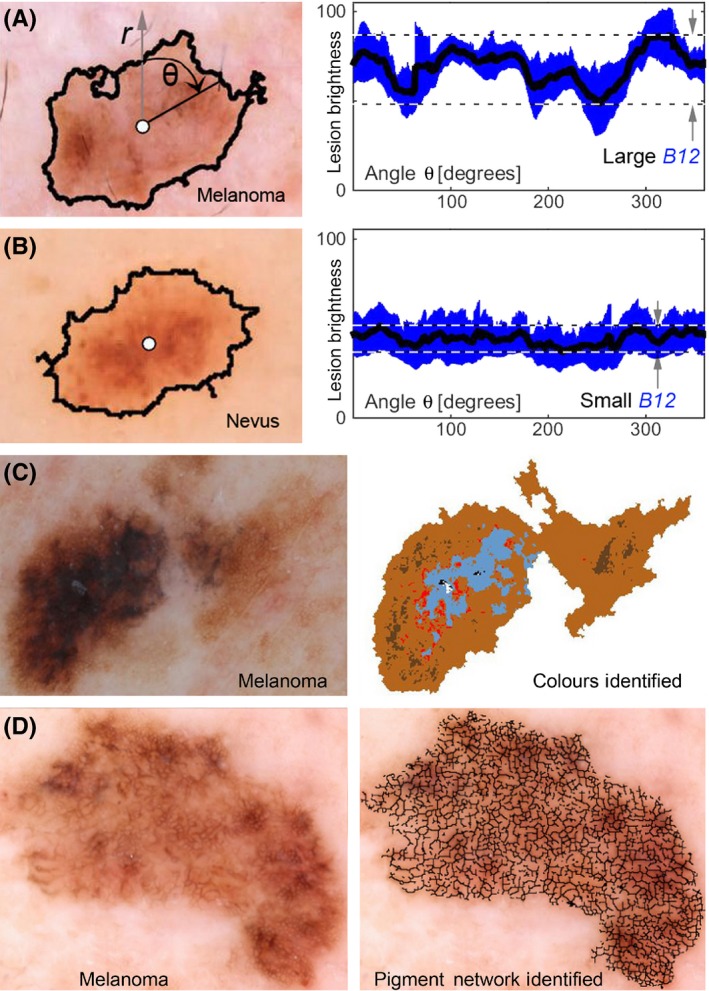
Figure 1.

Example melanoma imaging biomarkers. (A) and (B) show a melanoma and a nevus, respectively, where lesion centre (white circle) and peripheral border (black line) between lesion and normal skin are illustrated. The mean lesion brightness along the sweeping arm as a function of angle θ is plotted (black line) to the right with the standard deviation shown in blue. The melanoma imaging biomarker (MIB) B12 is graphically shown to be the brightness range over an angular sweep of the mean lesion pixel brightness. The range is divided by the mean to achieve the final B12 MIB. The images shown are of a melanoma that yields a large B12 value and a nevus that yields a small B12 value. A melanoma with multiple colours (C) is shown in colour map illustrating MIB MC1. A melanoma with an atypical reticular pigmented network (D) is shown with an overlay of the pigmented network branches. Each black line segment terminates on each end in either a branch point or an endpoint. Statistical analysis of these branches yielded MIBs B8, B11, B15, R3, R7 and R8
