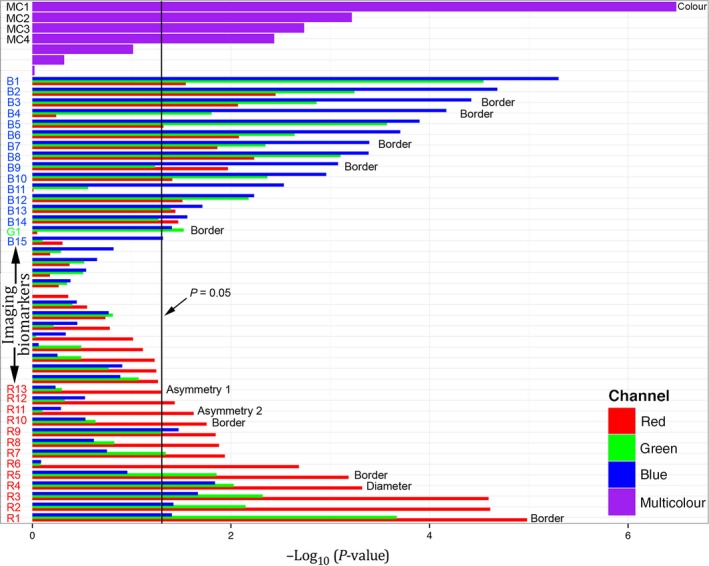
Figure 2.

The length of the horizontal bar, for each image feature extracted, is negative the base 10 logarithm of the P‐value, where the P‐value is the standard statistical significance metric, calculated using univariate, two‐tailed, unpaired t‐tests (for continuous variables) and Fisher's exact test (for categorical variables). For single colour channel metrics, three adjoined bars, colour‐coated red, green and blue show the importance when evaluated in the respective colour channels of the image. The melanoma imaging biomarkers (MIBs) with statistical significance for melanoma discrimination (P<.05, vertical black line) are labelled on the vertical axis describing the colour channel they were used in: B1‐B14 from the blue channel, G1 from the green channel and R1‐R13 from the red channel. MC1‐MC4 denote MIBs that used multiple colour channel information. The text to the right of the bars indicates MIBs that contain information based on the dermoscopic ABCD criteria. The most significant MIB was the number of colours identified in the lesion while the diameter of the lesion had intermediate significance and the asymmetry of the lesion silhouette (Asymmetry 1, illustrated in Figure S10) had borderline significance. The lesion border features (see Figure S4) pertain to the edge demarcation.
