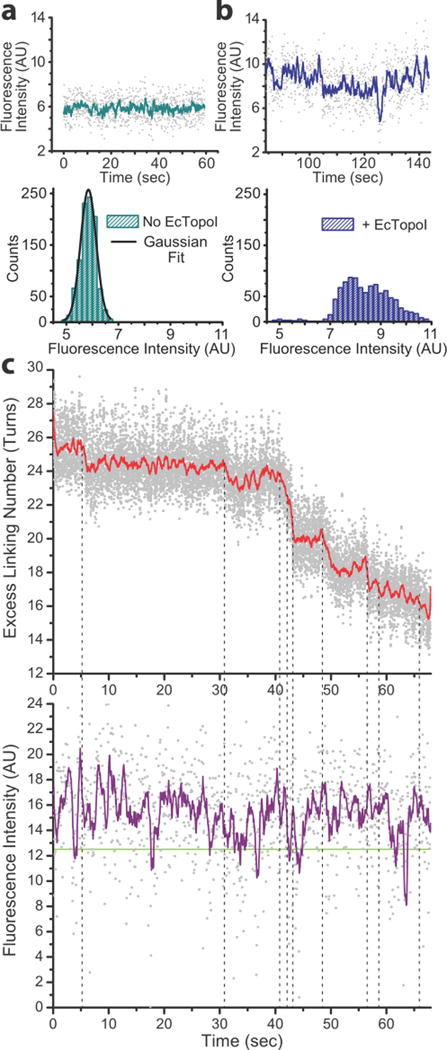
Figure 2. PIFE is observed upon EcTopoI binding to DNA.

a) The fluorescence intensity signal of the Cy3 molecule attached to the 22nt bulge in the DNA displays a Gaussian distribution of values. b) Adding buffer with 40 nM of EcTopoI to the fluorescent substrate in a, leads to an increase in fluorescence intensity and broadening of the distribution. Additionally, a deviation from a single Gaussian distribution of intensity values occurs and a shoulder appears at higher intensities. The distribution could be modelled by several different Gaussians representing different states, but the lack of distinct states precludes a definitive fit. c) Concurrent fluorescence and DNA extension traces were aligned in time (n=9 DNA molecules). MT traces were converted from extension to excess linking number and the raw data (gray) were smoothed using a 100-point boxcar average (red). Fluorescence traces were smoothed with a 10-point boxcar average (purple). Note that the representative data trace in c) comes from a different fluorophore than in plots a and b –and hence the intensity values are not directly comparable. The plots in a and b serve to illustrate the difference is shape for the intensity distributions. The green line at ≈12.4 AU fluorescence intensity marks the center of the Gaussian distribution when no protein was present (Supplementary Fig. 4). Intensities just above or below this line represent the no-PIFE (protein unbound) state. While there are transient excursions to the unbound state, the majority of the time PIFE is observed, including during pauses in relaxation. Vertical dotted lines mark the relaxation events; these were found to be correlated with local maxima in the fluorescence trace (PIFE spikes) (Supplementary Fig. 5).
