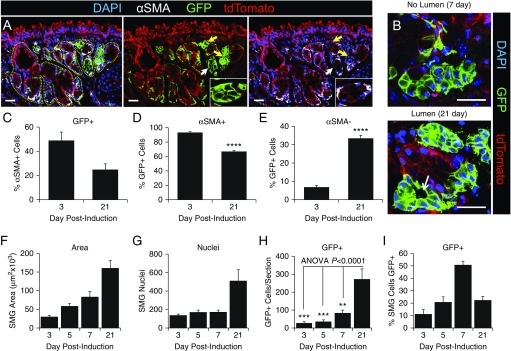
Figure 4.
Quantitative analysis of ACTA2-CreERT2-mediated GFP expression during submucosal gland development. (A) ACTA2-CreERT2:ROSA-TG mice were induced on the day of birth, and 21-day-old tracheal samples were then immunofluorescently evaluated for GFP, αSMA, and tdTomato expression. DAPI was used to mark nuclei. The glandular epithelium is marked by a yellow dashed line in the panel on the left and is an example of regions quantified for various endpoints. The asterisk in the left panel marks a vessel that is excluded from the quantification. Arrows mark GFP+ tubules, with the white arrow indicating the region of the inset in the right two panels. (B) Two examples of GFP+ SMG tubules without and with a visible lumen, during branching and differentiation phases, respectively. (C) The percentage of αSMA+ glandular cells that were also GFP+ at 3 and 21 days postinduction. (D) The percentage of GFP+ glandular cells that were also αSMA+. (E) The percentage of GFP+ glandular cells that did not express αSMA. (F–I) SMGs were quantified for (F) total area, (G) number of nuclei, (H) number of GFP+ cells per section, and (I) the percentage of SMG cells staining positive for GFP. Data depict the mean ± SEM of n = 4–8 mice from multiple sections >50 μm apart. Asterisks denote significance levels using (D and E) two-tailed Student’s t test or (H) one-way ANOVA with Bonferroni's post-test: **P < 0.01; ***P < 0.001; and ****P < 0.0001. Scale bars: 25 μm.

