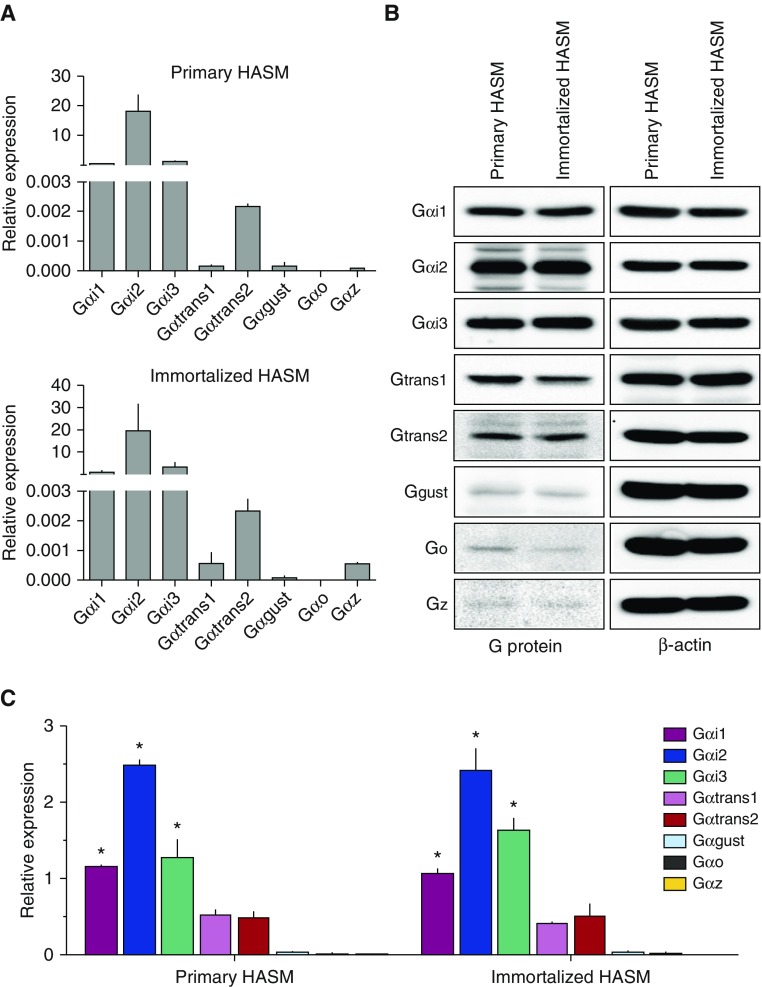
Figure 2.
Expression of Gα subunits in HASM. (A) Mean mRNA expression as determined by quantitative RT-PCR (three experiments). (B) Representative Western blots for the eight Gα subunits and β-actin (the exposures for Gαgust, Gαo, and Gαz were greater than the other subunits). (C) Mean (±SE) of protein expression presented as the ratio of the α subunit to β-actin from three to four experiments (*P < 0.001 compared with all other subunits).

