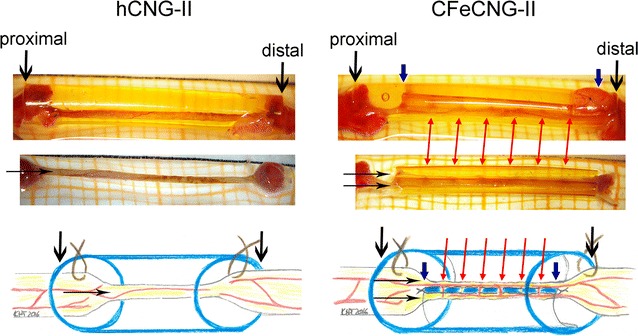
Fig. 4.

Presentation of the macroscopic appearance of the regenerated tissue upon explantation. At 150 days after delayed nerve reconstruction, the implants were explanted. Photographs and schematic drawings illustrate the macroscopic appearance of the regenerated tissue. Top row Representative photographs of regenerated tissue within the nerve guides (left hCNG-group, right CFeCNG-group). Center row Representative photographs of regenerated tissue after removal of the nerve guide (left hCNG-group, right CFeCNG-group with chitosan film still in place). Bottom row Schematic drawing of the regenerated tissue within the nerve guides (left hCNG-group, right CFeCNG-group), chitosan material is shown in blue. (1) Downwards-pointing in black indicating the outer edge of the chitosan nerve guide; (2) downwards-pointing in blue indicating the proximal and distal edge of the central chitosan film; (3) horizontal arrows in black indicating either single-stranded (hCNG-II) or double-stranded (CFeCNG-II) regenerated tissue; (4) red arrows point towards eventually vascularized tissue bridges between the two tissue cables in CFeCNGs
