
Fig. 2.
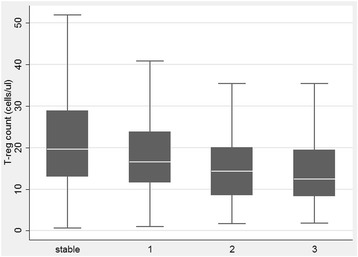
Relation between T-reg cells count and BOS grade (calculated according to BOS severity classification [30]). Figure is purely descriptive. Median, IQR and min/max are depicted. *p < 0.001; §p = 0.01
Official websites use .gov
A
.gov website belongs to an official
government organization in the United States.
Secure .gov websites use HTTPS
A lock (
) or https:// means you've safely
connected to the .gov website. Share sensitive
information only on official, secure websites.
Relation between T-reg cells count and BOS grade (calculated according to BOS severity classification [30]). Figure is purely descriptive. Median, IQR and min/max are depicted. *p < 0.001; §p = 0.01