
Fig. 3.
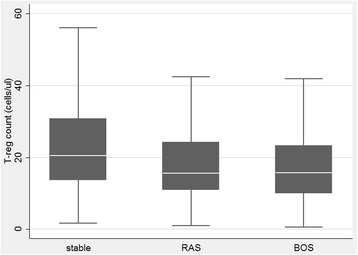
Relation between T-reg cells count and stable, BOS (p < 0.001) or RAS (p = 0.01) patients’ (BOS was diagnosed according to published guidelines [6, 30–32]. RAS has been retrospectively re-classified according to radiological and functional criteria [30–32]).). Figure is purely descriptive. Median, IQR and min/max are depicted