Fig. 2.

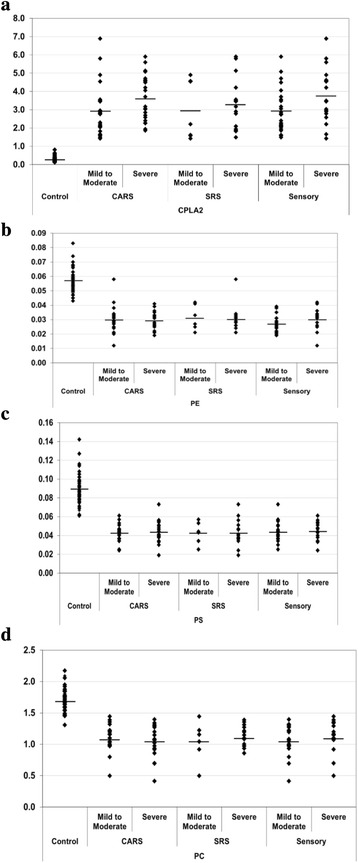
a: PE (mmol/L), (b) PS (mmol/L), (c) PC (mmol/L) (d) cPLA2 levels of control and autistic groups. The mean value for each group is designated by a line

a: PE (mmol/L), (b) PS (mmol/L), (c) PC (mmol/L) (d) cPLA2 levels of control and autistic groups. The mean value for each group is designated by a line