
Fig. 4.
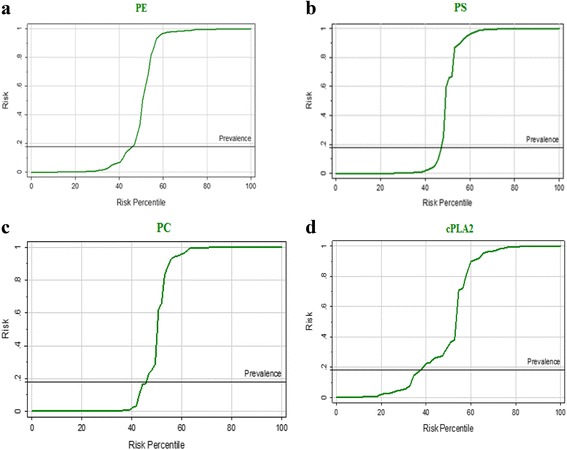
a: Predictiveness curve of PE (mmol/L), (b) PS (mmol/L), (c) PC (mmol/L), (d) cPLA2 levels of control and autistic groups
Official websites use .gov
A
.gov website belongs to an official
government organization in the United States.
Secure .gov websites use HTTPS
A lock (
) or https:// means you've safely
connected to the .gov website. Share sensitive
information only on official, secure websites.
a: Predictiveness curve of PE (mmol/L), (b) PS (mmol/L), (c) PC (mmol/L), (d) cPLA2 levels of control and autistic groups