
Fig. 5.
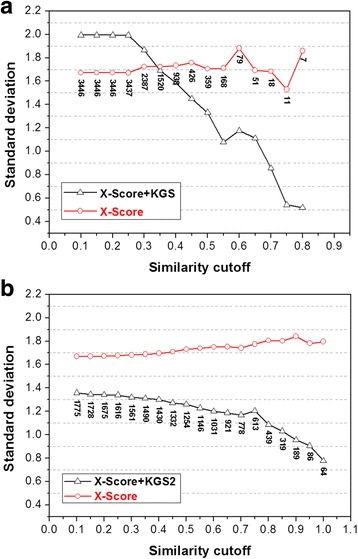
Comparison of the performance of KGS2 and KGS on the PDBbind refined set (version 2014). a The results given by X-Score + KGS; b The results given by X-Score + KGS2. In both figures, the x-axis indicates the similarity cutoff required in reference selection; The y-axis indicates the standard deviation (in logK a units) in fitting the computed binding scores to the experimental binding data on a particular subset of complexes. The number near each data point indicates the size of each subset, i.e. the number of complexes for which a reference complex can be found at this level of similarity cutoff. Results produced by X-Score alone are indicated by red round data points. Results produced by X-Score + KGS or X-Score + KGS2 are indicated by black triangular data points. Application of KGS or KGS2 produces more accurate results than the scoring function alone when the black line is below the red line