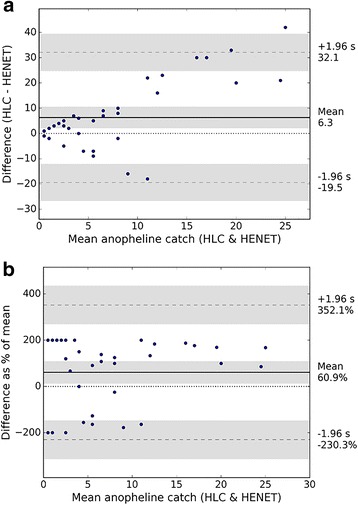
Fig. 3.

Bland-Altman analysis of total Anopheles over 39 nights of catches from human landing catches (HLC) and human-baited electrocuting nets (HENET). The line of equality (dotted line) represents perfect agreement between two methods. Mean difference (solid line) indicates bias from equality, limits of agreement are set at ± 1.96 standard deviations of mean difference (dashed line, s), and both are shown with 95% confidence intervals (shaded areas). a Mean vs difference. b Mean vs difference as a percentage of mean
