Fig. 3.

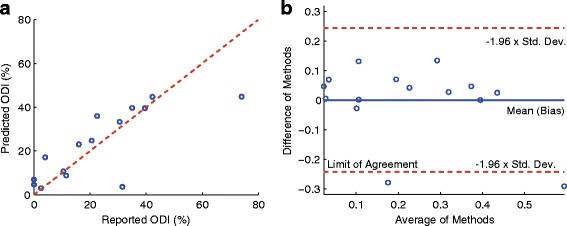
a Scatter plot between the reported ODI and predicted ODI scores, where the Spearman correlation coefficient r was 0.78, p<5.32×10⁻⁴, and RMSE of 0.13. b Bland-Altman plot where the bias was 2.41×10⁻¹⁷ and the limit of agreement was 0.24

a Scatter plot between the reported ODI and predicted ODI scores, where the Spearman correlation coefficient r was 0.78, p<5.32×10⁻⁴, and RMSE of 0.13. b Bland-Altman plot where the bias was 2.41×10⁻¹⁷ and the limit of agreement was 0.24