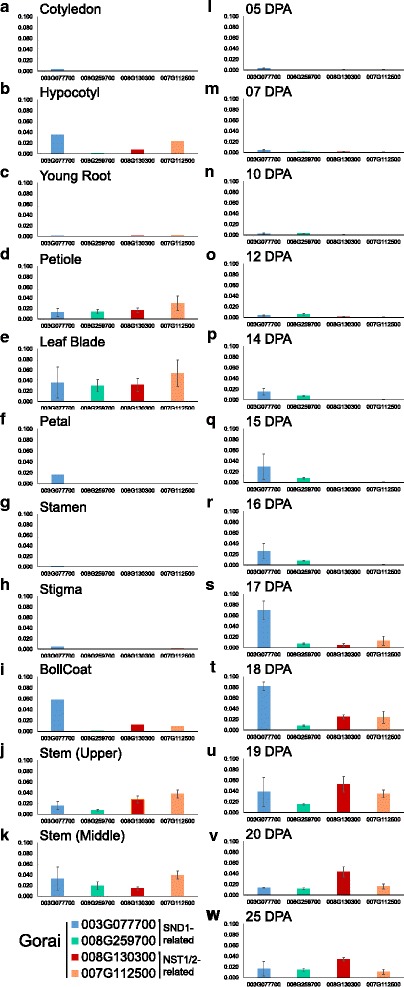
Fig. 4.

qPCR tissue profiling of select SND1 and NST1 NACs differentially expressed during cotton SCW development. qPCR based expression analysis was performed for key NACs that were differentially expressed between the different cotton SCW and PCW cell types. Comparative expression relative to ubiquitin is shown as relative abundance. These were SND1-like NACs (a) Gorai.003G077700 and (b) Gorai.008G259700, as well as NST1-related NACs (c) Gorai.007G112500 and (d) Gorai.008G130300. Expression profiling of the identified NACs in RNA from a range of tissues including a cotyledon, b hypocotyl, c young root, d petiole, e leaf blade, f petal, g stamen, h stigma, i boll coat, j upper stem, k middle stem, and a seed fibre developmental series from l 5 DPA, m 7DPA, n 10DPA, o 12 DPA, p 14 DPA, q 15 DPA, r 16 DPA, s 17 DPA, t 18 DPA, u 19 DPA, v 20 DPA, w 25 DPA Mean values ± SD are shown (n = 3), otherwise single replicates are shown. n.d., nil detected; DPA, days post anthesis
