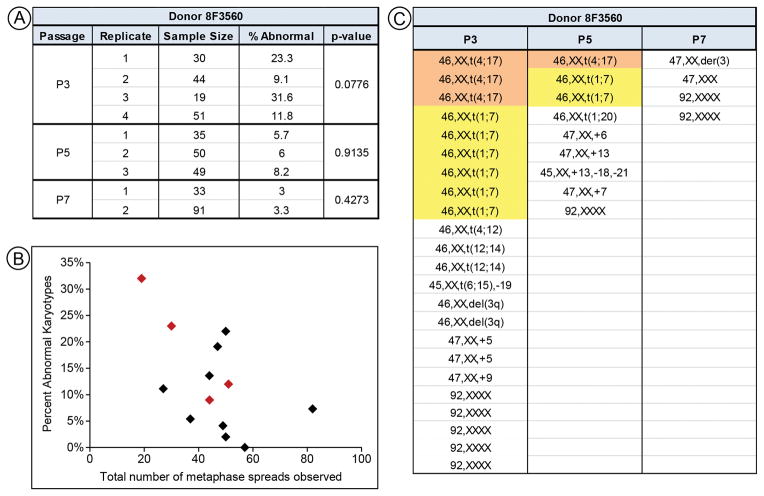
Figure 2.
Extended analysis on MSCs from donor 8F3560. (A) Results for individual replicates done on cells from donor 8F3560. P-values > 0.05 indicate a lack of significant differences between technical replicates. (B) Plot of the total number of metaphase spreads vs. percent abnormal karyoypes for all donors at P3. No correlation is observed. 8F3560 is indicated by red diamonds. (E) Table identifying all abnormal karyotypes from all replicates for each passage of cell line 8F3560. Clonal populations are highlighted.

