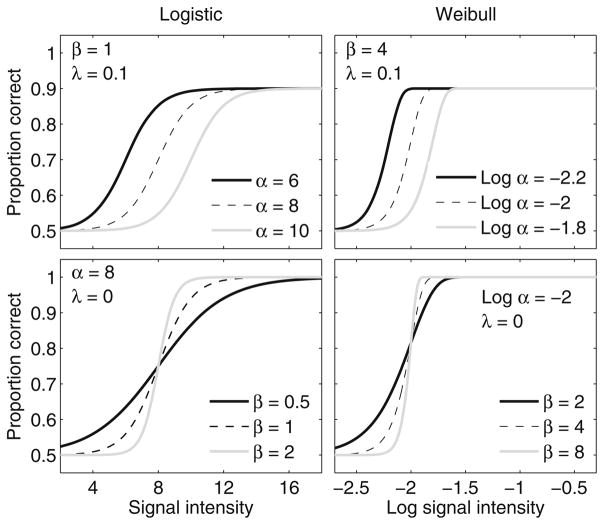
Fig. 1.
Logistic and Weibull formulations of the psychometric functions are presented in the left and right panels, respectively. For these examples, the chance proportion correct without a signal was .5 (i.e., γ = .5). For the top panels, the values of β and λ are fixed, and the different curves reflect differences in α. For the bottom panels, the values of α and λ are fixed, and the different curves indicate differences in the value of β

