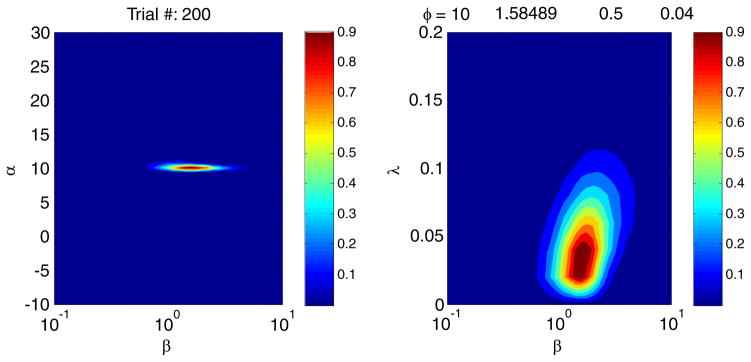
Fig. 4.
Posterior distributions for the simulation described for Fig. 3 are plotted using uml.PlotP ( ). The log probabilities of the values of α, β, and λ after 200 trials are projected onto two planes. For the left panel, the abscissa is the value of β, the ordinate is the value of α, and the title indicates the number of trials. For the right panel, the abscissa is the value of β, the ordinate is the value of λ, and the title indicates vector uml.phi, containing the current estimates of the α, β, γ, and λ parameters of the psychometric function

