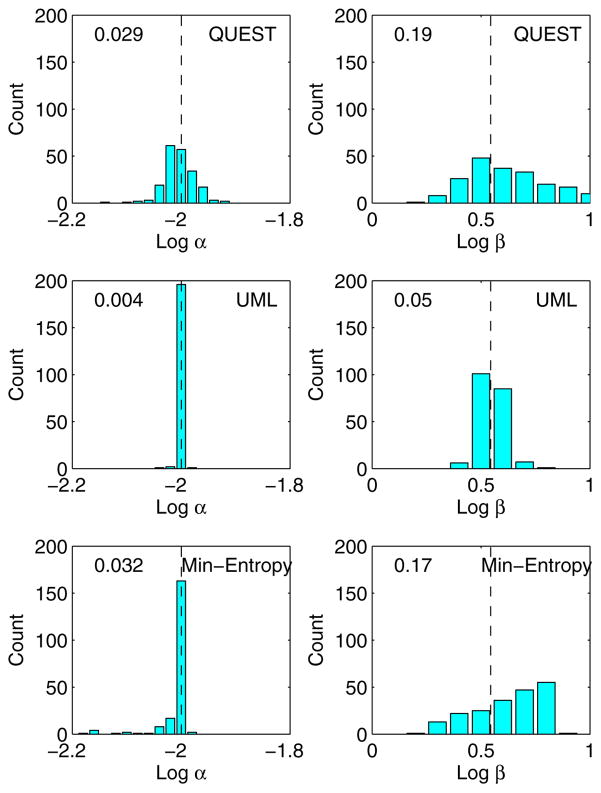
Fig. 7.
Histograms of the α (left) and β (right) estimates from 200 Monte-Carlo simulated tracks. Results are shown separately for the QUEST (top), UML (middle), and minimum-entropy (bottom) procedures, as implemented in the PsychToolbox, the UML Toolbox, and the Palamedes toolbox, respectively. The Weibull psychometric function used to generate simulated responses was determined by the “true” parameters: log α = −2, β = 3.5, γ= .5, and λ= .02. The “true” values for log α and log β are indicated as vertical dashed lines in each panel. The number inside each panel indicates the rms error of the estimates relative to the “true” value

