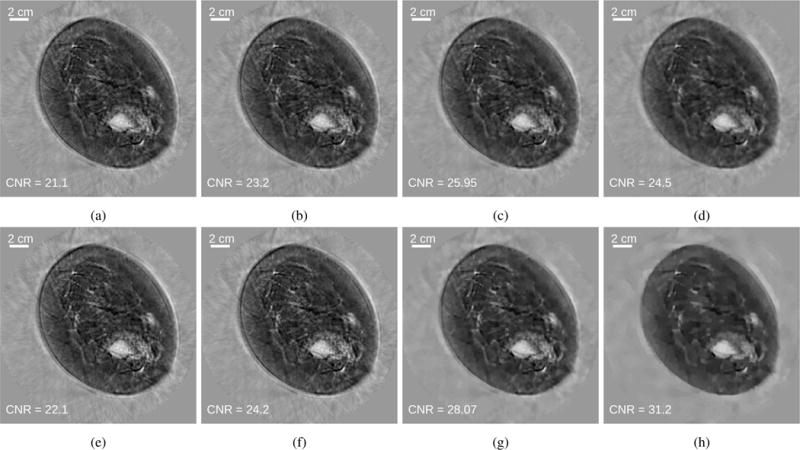
Fig. 17.

(Top row) Images reconstructed by use of SGD with a constant step size of 2.5 × 10⁵ and regularization parameter values of (a) 1 × 10⁻¹⁰, (b) 3 × 10⁻¹⁰, (c) 1 × 10⁻⁹, and (d) 3 × 10⁻⁹. (Bottom row) Images reconstructed by use of the weighted RDA method with regularization parameter values of (e) 1 × 10⁻¹⁰, (f) 3 × 10⁻¹⁰, (g) 1 × 10⁻⁹, and (h) 3 × 10⁻⁹. Images are shown after 100 iterations and in a grayscale window of [1.38, 1.60] mm/μs.
