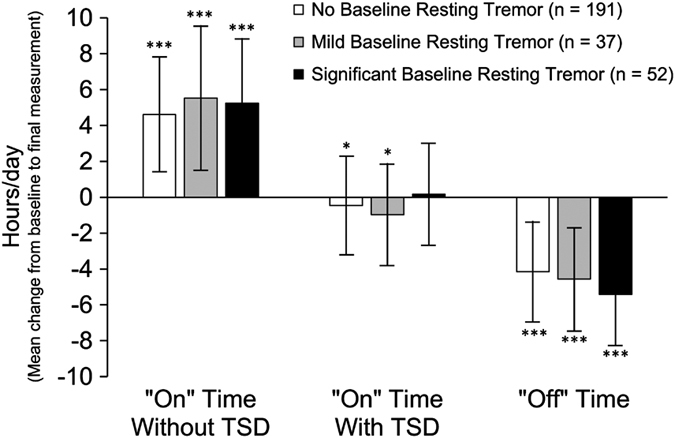
Figure 2.

Mean change from baseline in ‘Off’ time, ‘On’ time without TSD, and ‘On’ time with TSD. Data are the mean±s.d. Statistical significance versus baseline was calculated with a one-sample t-test, indicated by *P<0.05 and ***P<0.001. TSD, troublesome dyskinesia.
