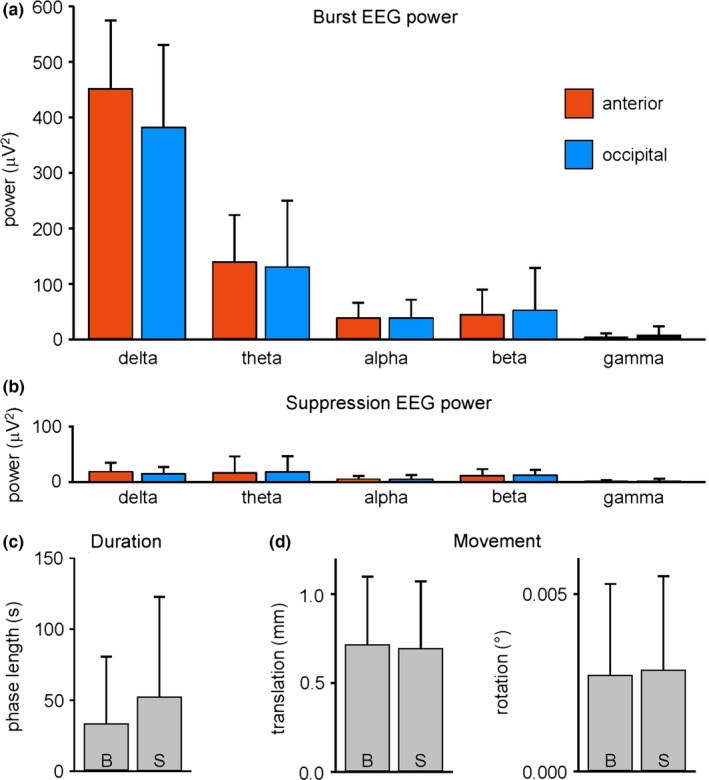
Figure 1.

(a) Burst and (b) suppression EEG signal power of the delta [0.5 Hz, 4 Hz], theta [4 Hz, 8 Hz], alpha [8 Hz, 12 Hz], beta [12 Hz, 30 Hz], and gamma band [30 Hz, 70 Hz] in pooled anterior (frontal, parietal, and temporal) and pooled occipital electrodes (frequency analyses of EEG signals with a minimum of 30 s length were included into the plots, resulting in data from 11 subjects). (c) Length of all 145 burst and all 147 suppression phases included in fMRI group analysis (resulting in data from 19 subjects). (d) Head movement shown as maximum translation and rotation occurring in the burst and suppression phases. All bars are means + SD; B burst, S suppression
