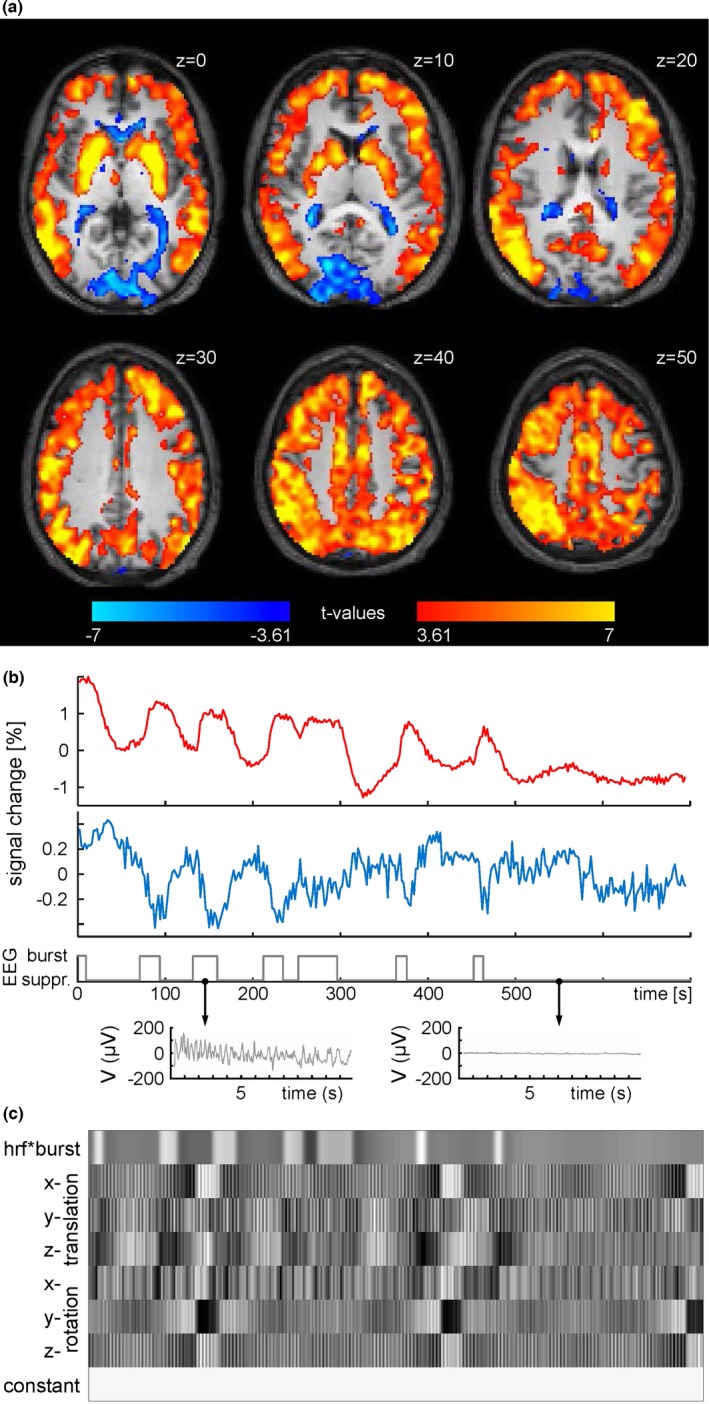
Figure 2.

(a) Group statistics (n = 19) shown as voxel‐wise t‐values of a GLM modeling burst on the EEG as regressor of interest in a 700 s dataset in warm colors and an opposing contrast (“−1”) modeling anticorrelated signal changes in cold colors (347 volumes, one‐sample t‐test, p < .001, uncorrected). t = 3.61 corresponds to p = .001; t = 7 corresponds to p = .000008. Axial brain slices at z positions (according to MNI system) as indicated. (b) Raw time courses of ROIs from Harvard‐Oxford Atlas. Red trace: bilateral caudate nucleus. Blue trace: bilateral intracalcarine cortex. Gray trace: EEG classification and detail view of the recording from an occipital electrode. (c) Matrix for the subject also shown in (b), illustrating the individual GLM which includes burst appearance convoluted with the canonical HRF, six movement parameters and a constant term
