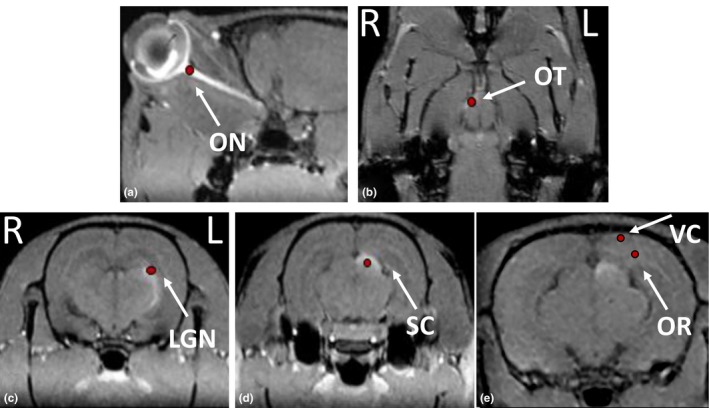
Figure 3.

Representative manganese‐enhanced MR images to display the placement of regions of interest for the measurement of signal intensities. a, the level of optic nerve; b, the level of optic tract; c, the level of lateral geniculate nucleus; d, the level of superior colliculus; e, the level of optic radiation and visual cortex
