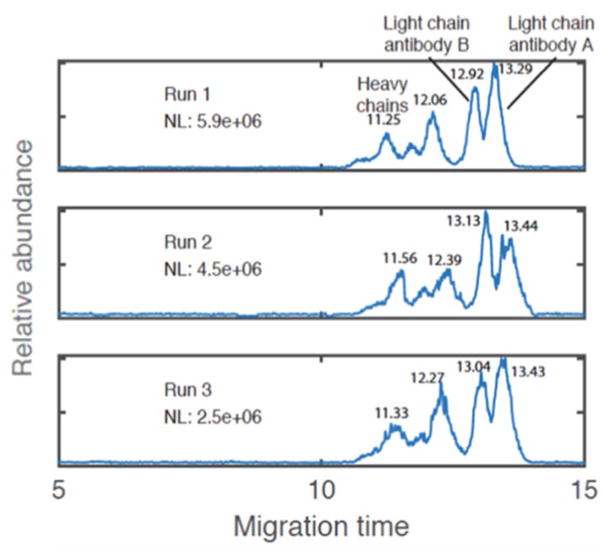
Figure 12.
Base peak electropherograms for a two-antibody mixture (mouse anti-human IgG4 Fc-UNLB and human/mouse/rat activin A beta A subunit antibody), including migration times for each heavy chain and light chain. Triplicate CZE–ESI–MS analysis of a two-antibody mixture. 50 cm long, 30 μm I.D. capillary was used for separation. About 30 nL liquid aliquot was injected for each analysis. Sheath liquid: 0.5% FA, 10% methanol. Voltages: 23.7 kV/1.2 kV. LTQ-XL mass spectrometer was used for detection. NL is the normalization level. (Modified from reference168 with permission)

