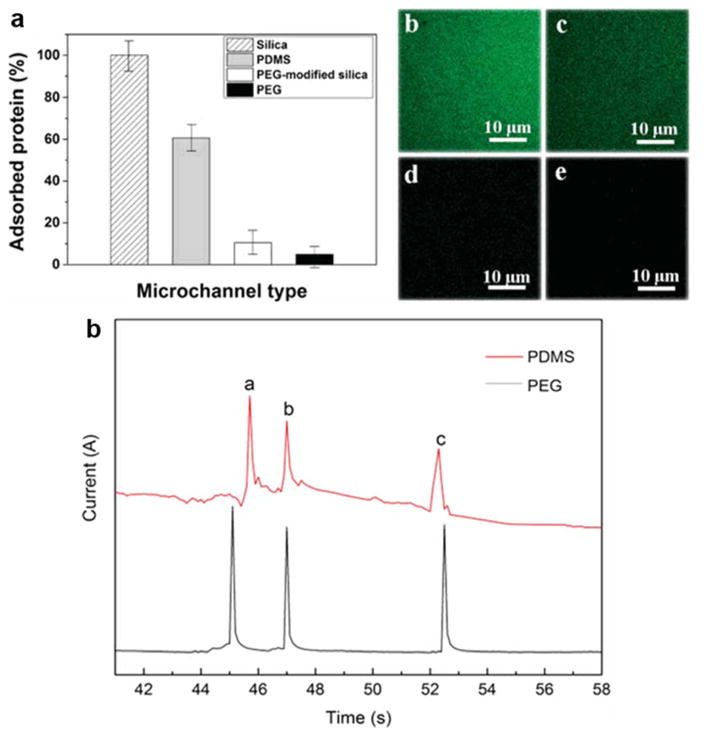
Figure 7.
Efficacy of PEG microchannel in preventing protein adsorption (a) and fluorescent images of FITC-BSA adsorption in silica (b), PDMS (c), PEG-modified silica (d), and PEG (e) microchannels. Comparison of the anti-protein-fouling PEG MCE with traditional PDMS MCE in protein separation performance (f). Separation conditions: buffer, 40mM phosphate (pH = 6.0); applied voltage, +200 V; sample, 0.5 mg/ml for each protein; microchannel, 14 cm × 50 μm × 50 μm (13.3 cm effective); temperature, 25 °C. Peak identification: (a) Cyt-c; (b) Lys; (c) BSA. (Modified from reference99 with permission)

