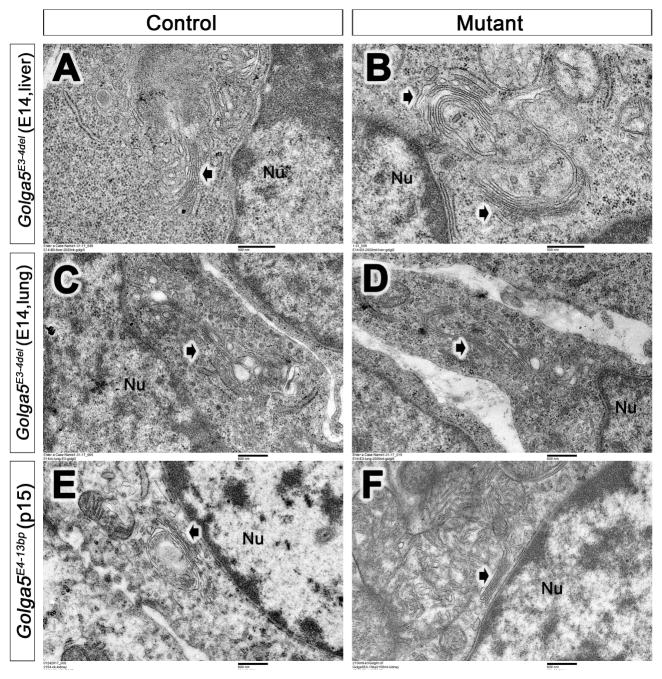
Figure 4. Electron microscopy (TEM) analysis of Golgi structures in Golga5 mutant mouse tissues.
(A–D) Representative cells from E14.5 Golga5E3-4del/E3-4del homozygous embryonic liver (B) and lung (D) tissues exhibit similar Golgi (white arrows) structures as in their control littermate (A, C). (E, F) Representative kidney cells from P15 Golga5E4-13bp/E4-13bp mutant (F) and control (E) littermates. White arrow points to the Golgi. Nu, nucleus. Scale bar in A and B, 500 nm; scale bar in C–F, 600 nm.

