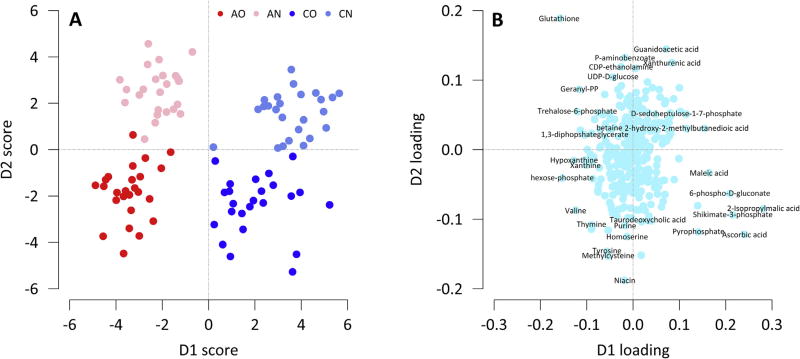
Fig. 1.
PCA-DA analysis of metabolomics data. The data were processed as described in the methods section. The scores plot (A) shows a separated clustering of each of the study subgroups. Asthma and controls were separated along the D1-Scores axes. The loadings plot (B) shows the compounds responsible for the separation of asthma subgroups from control subgroups along the D1-loadings axes. Several of these compounds were previously identified during the statistical t-test group comparison and the random forest analysis (e.g. 2-isopropylmalic acid, ascorbic acid etc.).

