
Figure 1.
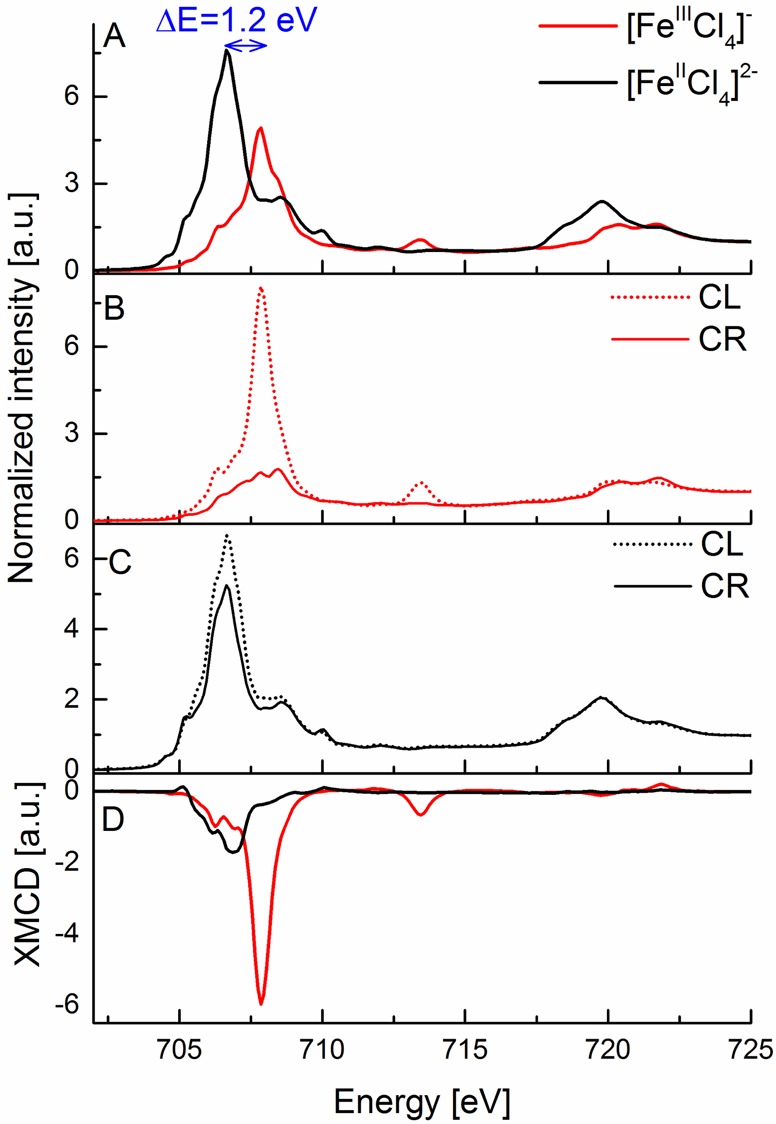
(A) Experimental Fe L2,3-edge X-ray absorption spectra of [FeIIICl4]− (red) and [FeIICl4]2– (black) complexes. (B, C) Experimental Fe L2,3-edge X-ray absorption spectra at 6 T magnetic field with circularly right (solid line) and circularly left (dashed line) polarized light for [FeIIICl4]− (red, B) and [FeIICl4]2– (black, C) complexes. (D) Experimental Fe XMCD spectra of [FeIIICl4]− (red) and [FeIICl4]2– (black) complexes. The blue arrow in (A) indicates the shift between the maxima of the L3-edge peaks for these complexes.