
Figure 2.
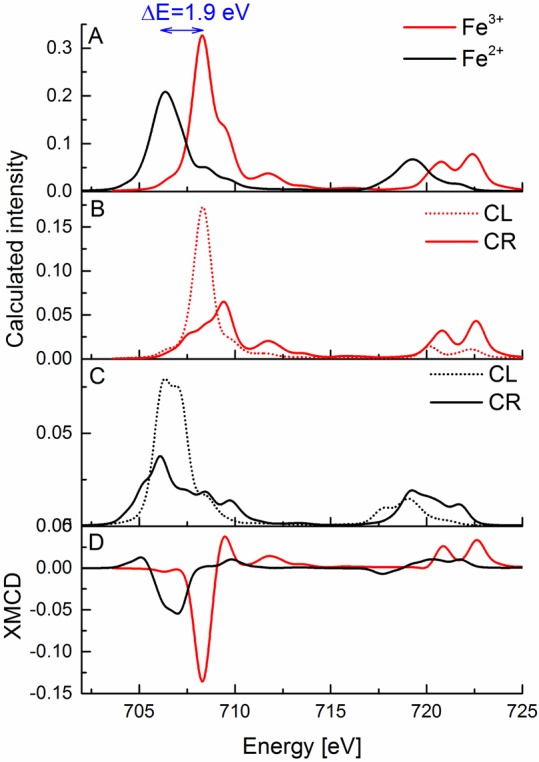
(A) Calculated Fe L2,3-edge X-ray absorption spectra of Fe3+ (red) and Fe2+ (black) systems. (B, C) Calculated Fe L2,3-edge X-ray absorption spectra with circularly right (solid line) and circularly left (dashed line) polarized light for Fe3+ (red, B) and Fe2+ (black, C) systems. (D) Calculated Fe XMCD spectra of Fe3+ (red) and Fe2+ (black) complex systems. The blue arrow in (A) indicates the shift between the maxima of the L3-edge peaks for the calculated spectra.