
Figure 5.
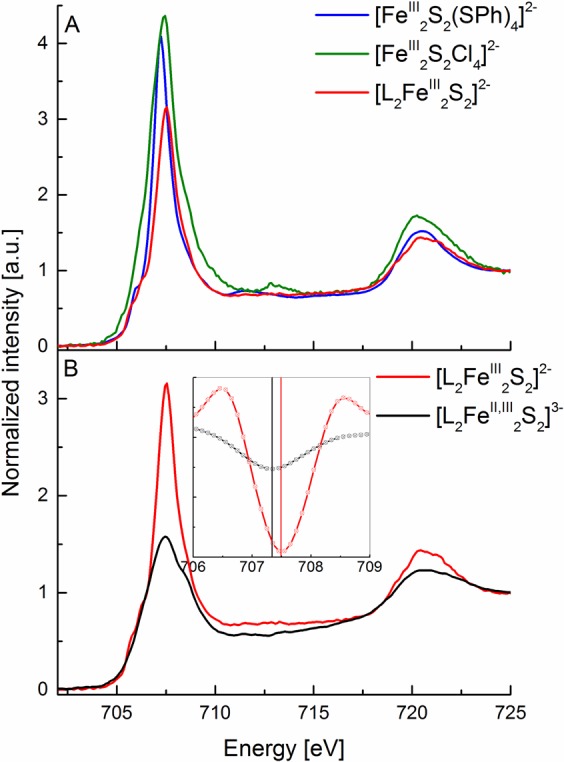
(A) Experimental Fe L2,3-edge X-ray absorption spectra of [FeIII2S2(SPh)4]2− (blue), [FeIII2S2Cl4]2− (green), [L2FeIII2S2]2− (red). (B) Experimental Fe L2,3-edge X-ray absorption spectra of [L2FeIII2S2]2– (red) and [L2FeII,III2S2]3– (black) complexes (B). The inset plot shows the ∼0.2 eV energy difference in the second-derivative spectra (smoothed using the second-order polynomial Savitzky–Golay algorithm in order to obtain better peak definition) in the L3-edge maximum between the [L2FeIII2S2]2– (red) and [L2FeII,III2S2]3– (black) complexes.