
Figure 8.
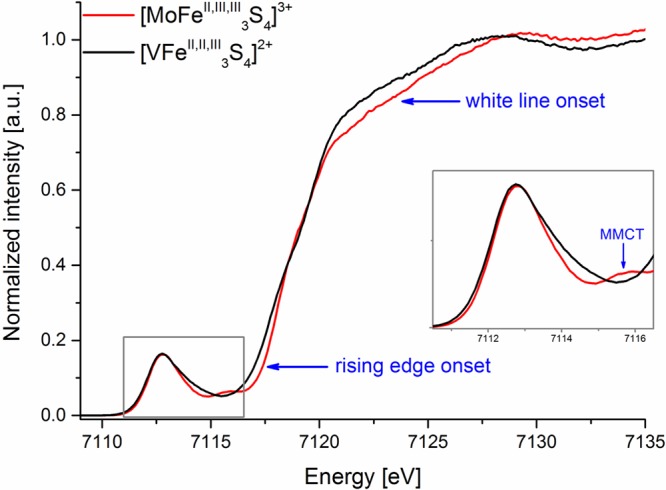
Experimental Fe Kα-detected high energy resolution fluorescence detected X-ray absorption spectra of [VFe3II,II,IIIS4]2+ (black) and [MoFe3II,III,IIIS4]3+ (red) complexes. The inset shows an enlargement at the pre-edge region marked with a gray rectangle. The blue arrows point toward the rising edge and white line onsets as well as indicate the MMCT feature. Adapted from ref (19), published by The Royal Society of Chemistry. See open access article: http://pubs.rsc.org/en/content/articlehtml/2017/dt/c7dt00128b.