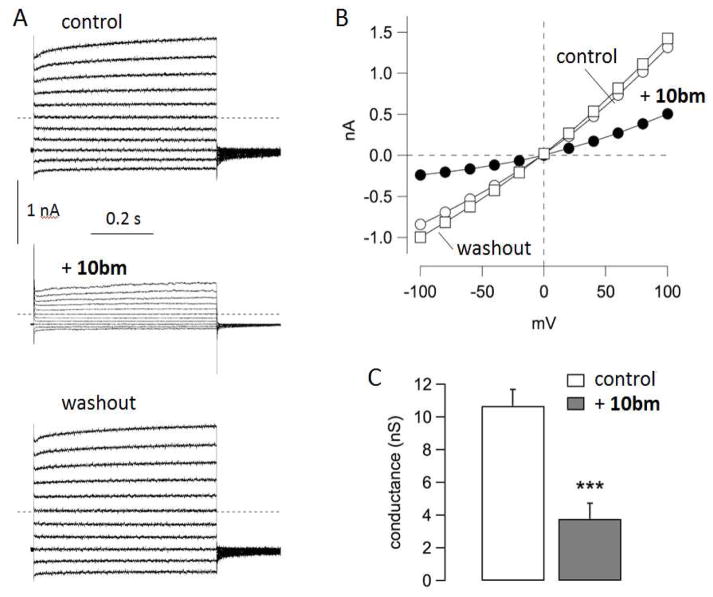
Figure 4.
Patch-clamp studies of TMEM16A inhibition by 10bm. A. Representative currents recorded from an inside-out membrane patch. Cytosolic (bath) free Ca2+ concentration was 305 nM. Each panel of traces show superimposed membrane currents elicited at membrane potentials in the range −100 to +100 mV. Currents were recorded under control conditions, after application by perfusion of 10bm (250 nM), and after washout. B. Current-voltage relationships from the experiment shown in A. Current values were measured at the end of each voltage step. C. Summary of conductance values at +100 mV obtained from five independent experiments (***, p < 0.001 by paired t test).

